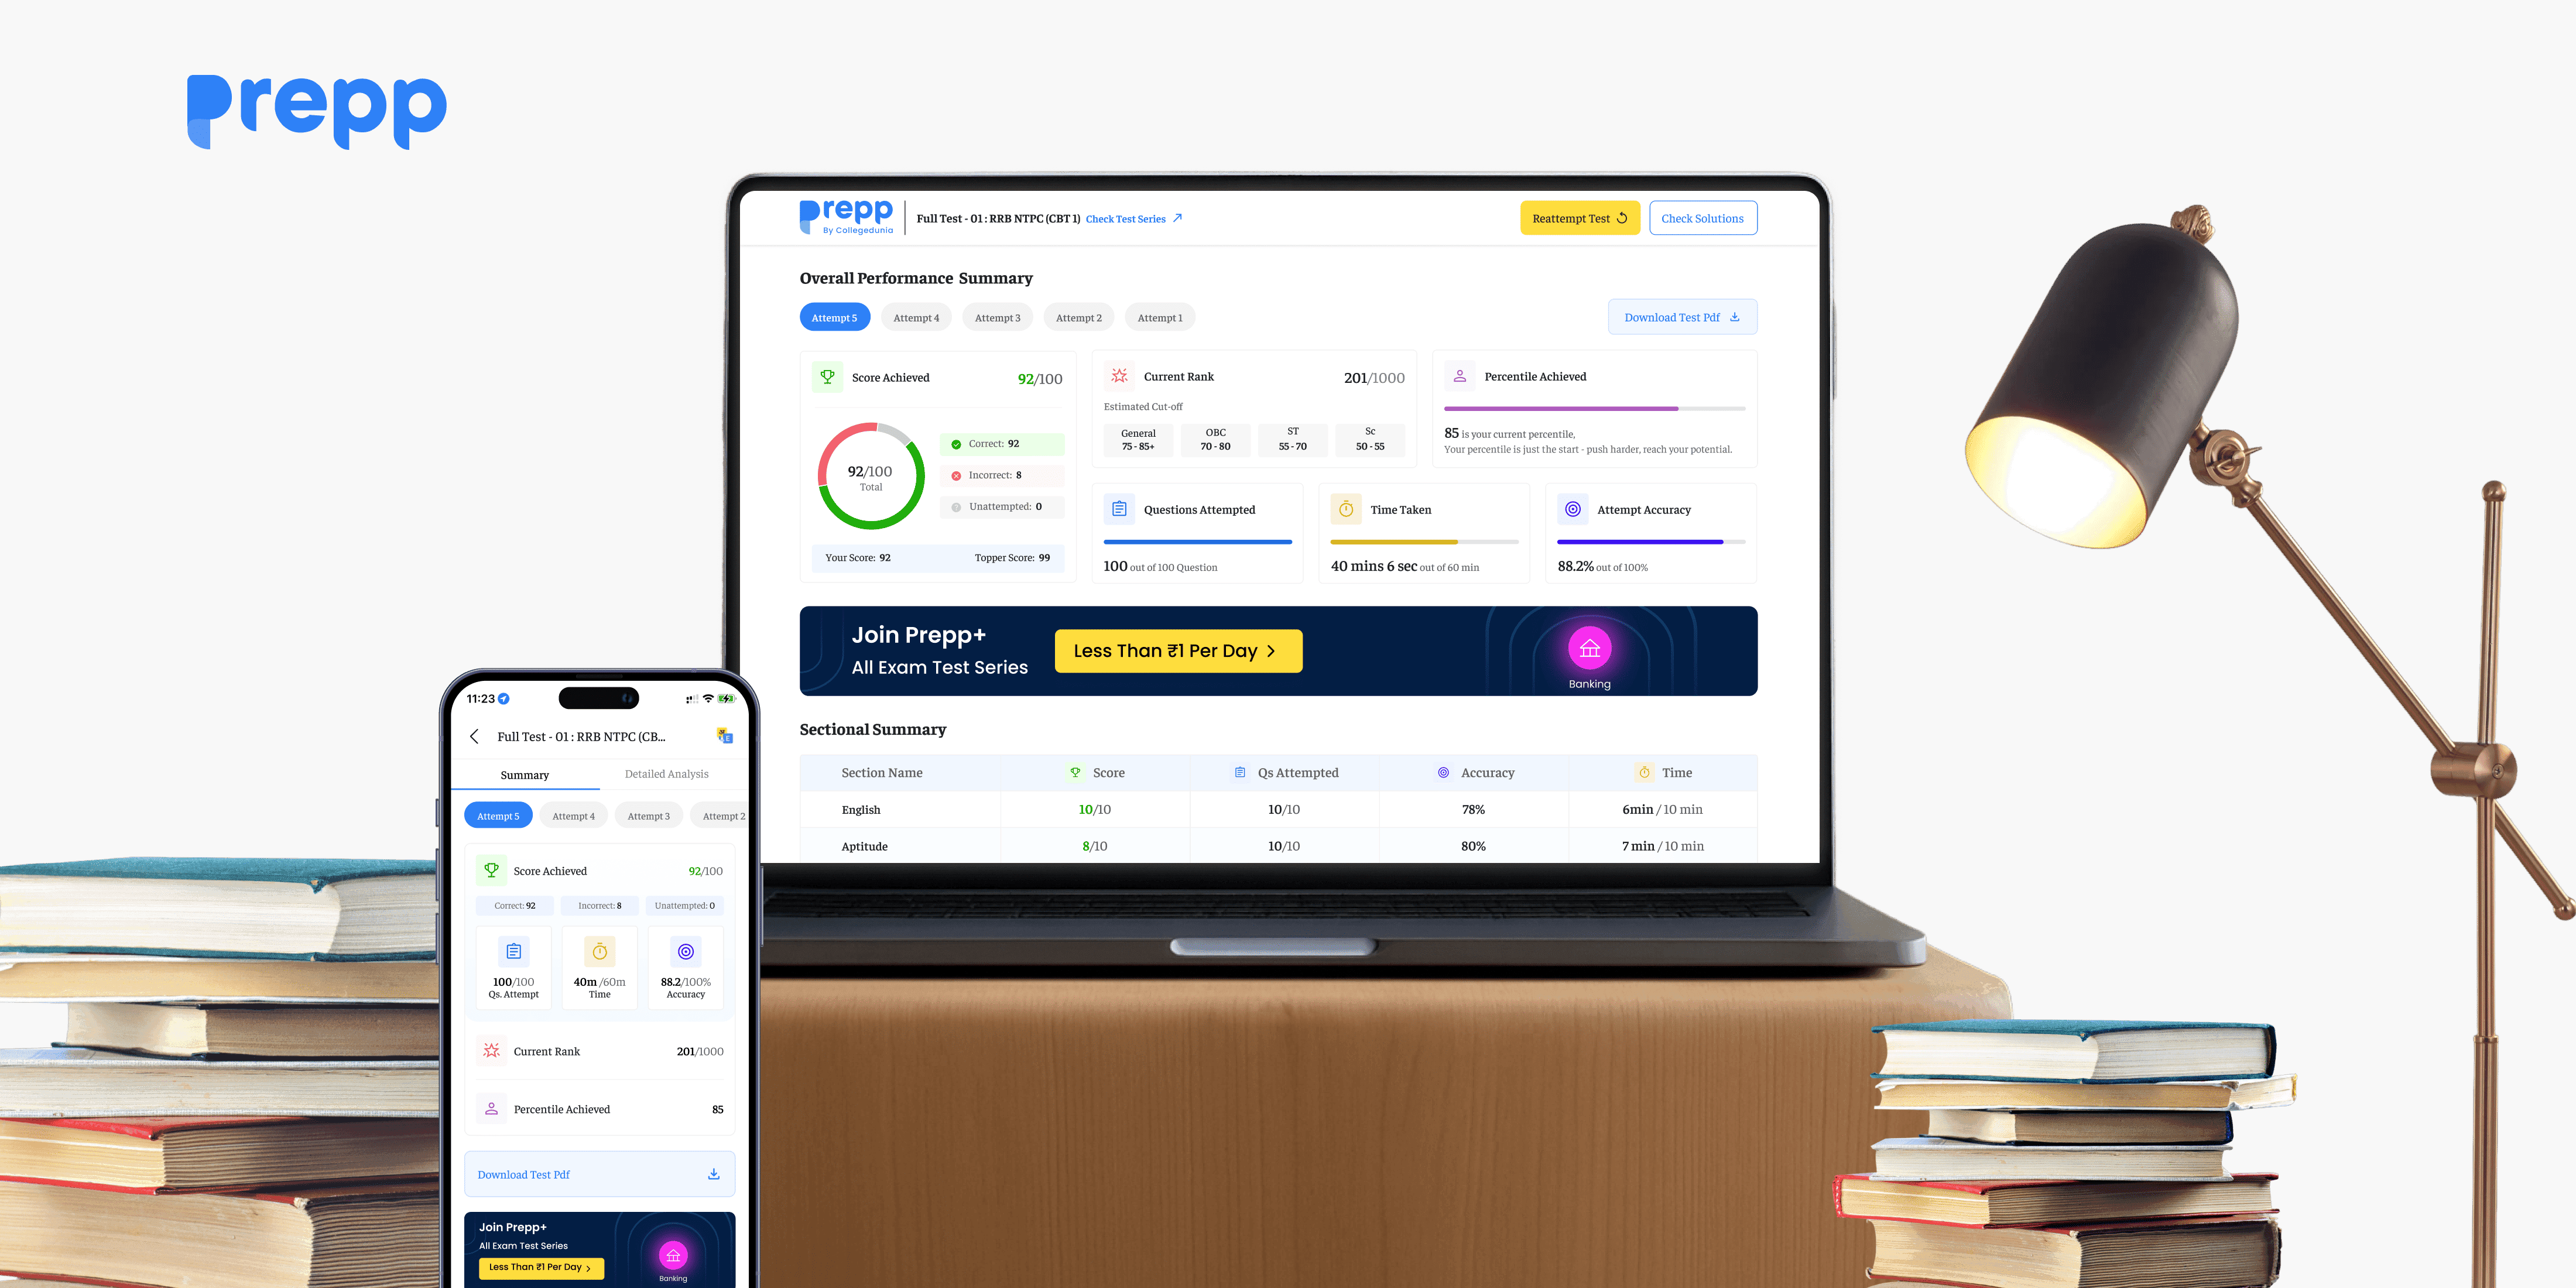

PrePP Test Result Dashboard
It is an online platform providing exam preparation resources, current affairs, and study materials for competitive exams.
❖ Problem
Prepp’s Test Result Dashboard hadn’t changed since launch. Students could see their scores but struggled to understand their strengths, weaknesses, and progress.
❖ Solution
I redesigned the dashboard with a clearer hierarchy, charts, actionable insights, and a multi-attempt progress view. Engagement with insights rose 28%, and drop-offs fell 20%.
• My Role
UI/UX Designer: competitor analysis, feature scoping, interaction design, Research
• Team Members (Me+4)
Srishti Dudeja - Senior Designer, Sarthak Sharma - Product Manager, Swati Gupta - Frontend Engineer, Manish Goyal - Backend Engineer
• Timeline
3 weeks, July to Aug 2025
Overview
Overview
Prepp is an online learning platform providing exam preparation resources, mock tests, study materials, performance tracking, and career guidance.
Prepp is an online learning platform providing exam preparation resources, mock tests, study materials, performance tracking, and career guidance.
As a UI/UX Designer, I led the redesign of the Test Result Dashboard page to simplify complex performance data and improve result discoverability. I restructured the information hierarchy, enhanced data visualization, and introduced actionable insights to help students quickly identify strengths, weaknesses, and progress trends.
As a UI/UX Designer, I led the redesign of the Test Result Dashboard page to simplify complex performance data and improve result discoverability. I restructured the information hierarchy, enhanced data visualization, and introduced actionable insights to help students quickly identify strengths, weaknesses, and progress trends.
After launching the redesigned Result Dashboard, students were able to better understand their performance, resulting in a 28% increase in engagement with insights, a 10% improvement in result discoverability, and a 20% reduction in drop-offs during result analysis.
After launching the redesigned Result Dashboard, students were able to better understand their performance, resulting in a 28% increase in engagement with insights, a 10% improvement in result discoverability, and a 20% reduction in drop-offs during result analysis.
What Was the Problem?
What Was the Problem?
The Result Dashboard had remained largely unchanged since the product's initial launch. As user behavior, data consumption patterns, and design standards evolved, the existing experience struggled to present performance insights in the most effective and engaging way.
The Result Dashboard had remained largely unchanged since the product's initial launch. As user behavior, data consumption patterns, and design standards evolved, the existing experience struggled to present performance insights in the most effective and engaging way.
This limited aspirants' ability to quickly understand their results, identify key takeaways, and make informed decisions about their preparation.
This limited aspirants' ability to quickly understand their results, identify key takeaways, and make informed decisions about their preparation.
Here are the key insights from student engagement patterns on this page.
Here are the key insights from student engagement patterns on this page.
20% ↓
20% ↓
Reduced Interactivity on result
page post test
Reduced Interactivity on result page post test
42% Less
42% Less
Aspirants reattempted tests, reducing user trust
Aspirants reattempt the test, reducing user trust
10%
10%
Aspirants face difficulty interpreting results on this page
Aspirants face difficulty interpreting results on this page
How Users & Business Were Affected?
How Users & Business Were Affected?
The outdated result page failed to meet evolving user expectations, creating usability challenges that impacted learning and progress tracking.
The outdated result page failed to meet evolving user expectations, creating usability challenges that impacted learning and progress tracking.
Limited Performance Insights :-
Limited Performance Insights :-
Users could view their scores but struggled to understand strengths, weaknesses, and improvement areas due to the lack of actionable analytics.
Users could view their scores but struggled to understand strengths, weaknesses, and improvement areas due to the lack of actionable analytics.
No Progress Tracking Graph :-
No Progress Tracking Graph :-
Comparing performance across multiple tests was cumbersome, making it hard for aspirants to identify growth patterns and measure preparation effectiveness.
Comparing performance across multiple tests was cumbersome, making it hard for aspirants to identify growth patterns and measure preparation effectiveness.
Low Motivation to Improve :-
Low Motivation to Improve :-
The result page focused on displaying outcomes rather than guiding the next steps, leaving users uncertain about how to improve their performance.
Alternative Measures :-
Alternative Measures :-
Many aspirants relied on spreadsheets, notes, and screenshots to track progress, creating a fragmented experience that reduced engagement and insights.
Many aspirants relied on spreadsheets, notes, and screenshots to track progress, creating a fragmented experience that reduced engagement and insights.
Impact on Business :-
Impact on Business :-
Users often left after viewing results, reducing opportunities for Prepp to generate revenue through courses and premium offerings.
Users often left after viewing results, reducing opportunities for Prepp to generate revenue through courses and premium offerings.

Before the Redesign
Before the Redesign

Connecting the project with business goals
Connecting the project with business goals
Prepp aims to unlock potential of 20,000+ test-takers by improving awareness of analytics, performance tracking, and learning features, helping users move beyond scores toward deeper engagement and structured improvement.
Prepp aims to unlock potential of 20,000+ test-takers by improving awareness of analytics, performance tracking, and learning features, helping users move beyond scores toward deeper engagement and structured improvement.
Drive Platform Retention & Growth :-
Drive Platform Retention & Growth :-
Leverage the test result page as a strategic engagement channel to increase repeat usage, strengthen learning habits, and ultimately improve user retention and long-term platform value.
Leverage the test result page as a strategic engagement channel to increase repeat usage, strengthen learning habits, and ultimately improve user retention and long-term platform value.
Improve Engagement with Test Results :-
Improve Engagement with Test Results :-
Transform the result experience into a meaningful touchpoint by making insights more actionable, encouraging users to revisit, analyze, and improve their performance rather than passively viewing scores.
Transform the result experience into a meaningful touchpoint by making insights more actionable, encouraging users to revisit, analyze, and improve their performance rather than passively viewing scores.
Enhanced Awareness :-
Enhanced Awareness :-
Increase awareness among test-takers about Prepp’s ecosystem, including analytics, learning resources, and insights to help understand progress and performance gaps.
Increase awareness among test-takers about Prepp’s ecosystem, including analytics, learning resources, and insights to help understand progress and performance gaps.
Competitive Analysis
Competitive Analysis
With a clear understanding of the key usability issues, we began our research by analyzing competitor result experiences and gathering feedback from active test-takers.
With a clear understanding of the key usability issues, we began our research by analyzing competitor result experiences and gathering feedback from active test-takers.
We conducted competitive benchmarking to identify gaps in Prepp’s result experience, analyzing how leading platforms present performance insights, progress tracking, and actionable feedback to users.
We conducted competitive benchmarking to identify gaps in Prepp’s result experience, analyzing how leading platforms present performance insights, progress tracking, and actionable feedback to users.

User Interviews & Concept Validation
User Interviews & Concept Validation
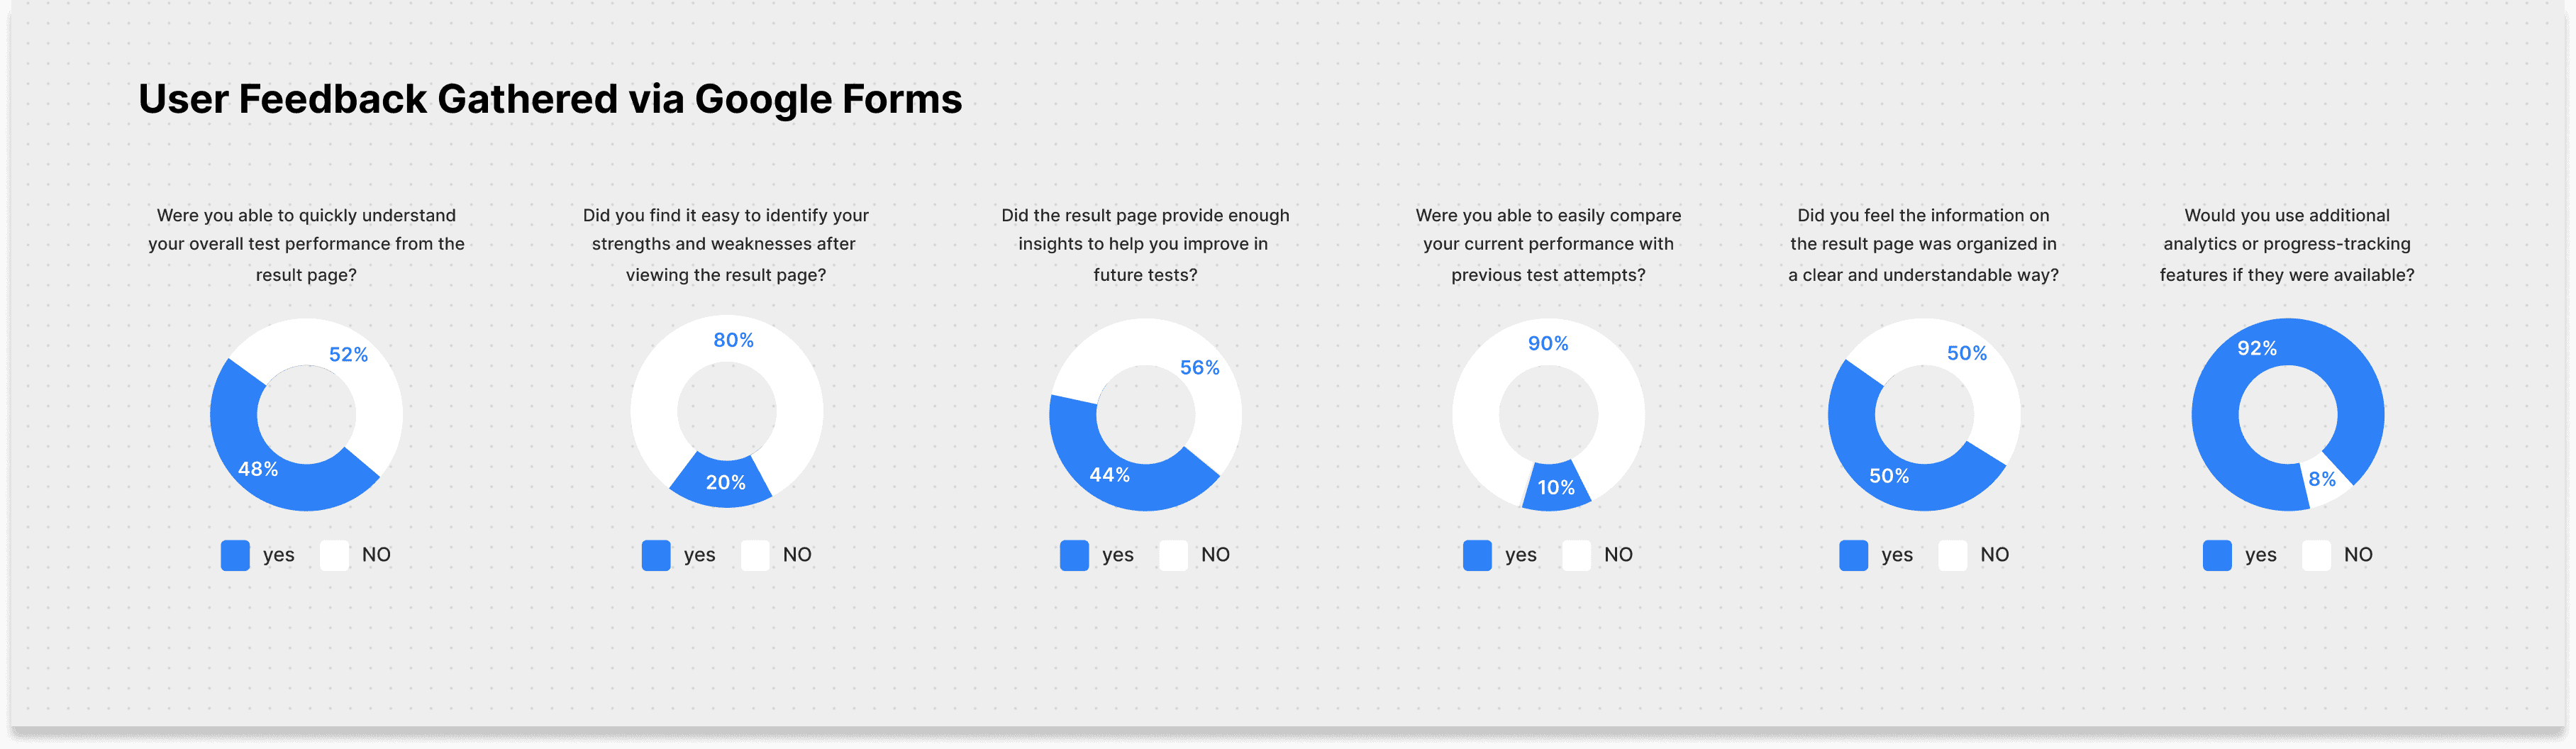
Over several weeks, I interviewed aspirants via Google Meet and gathered feedback through Google Forms. These insights helped identify key challenges, validate solution ideas, and refine the experience based on real user feedback.
Over several weeks, I interviewed aspirants via Google Meet and gathered feedback through Google Forms. These insights helped identify key challenges, validate solution ideas, and refine the experience based on real user feedback.

Research Insights
Research Insights
1.
1.
Most leading learning platforms present test results using a clear and structured information hierarchy, making performance insights easier to understand.
Most leading learning platforms present test results using a clear and structured information hierarchy, making performance insights easier to understand.
2.
2.
Key metrics such as scores, accuracy, time, rank, and progress trends are grouped logically to reduce cognitive effort.
Key metrics such as scores, accuracy, time, rank, and progress trends are grouped logically to reduce cognitive effort.
3.
3.
Placing course promotions and premium feature cards within the result analysis journey creates opportunities for upselling and supports revenue growth.
Placing course promotions and premium feature cards within the result analysis journey creates opportunities for upselling and supports revenue growth.
4.
4.
Visual elements like charts, comparisons, and progress indicators improve comprehension and make insights more actionable.
Visual elements like charts, comparisons, and progress indicators improve comprehension and make insights more actionable.
5.
5.
The distinction between summary-level insights and detailed analysis helps users navigate results
more intuitively.
The distinction between summary-level insights and detailed analysis helps users navigate results
more intuitively.
Design Ideation
Design Ideation
After multiple iterations and sketch explorations, we refined how test results, insights, and progress are structured to make performance understanding clearer, simpler, and more meaningful for students.
After multiple iterations and sketch explorations, we refined how test results, insights, and progress are structured to make performance understanding clearer, simpler, and more meaningful for students.
Test Result View ( Single Attempt)
Test Result View ( Single Attempt)
This design displays results for a single attempt of any mock test taken by a aspirant.
This design displays results for a single attempt of any mock test taken by a aspirant.

After the Redesign
After the Redesign
Test Result View ( Multiple Attempts)
Test Result View ( Multiple Attempts)
This design displays results for multiple mock test attempts, showing the last 5 attempts to easily compare performance and track student progress over time.
This design displays results for multiple mock test attempts, showing the last 5 attempts to easily compare performance and track student progress over time.